Click here to start
Table of contents
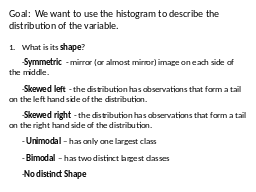
Slide 1
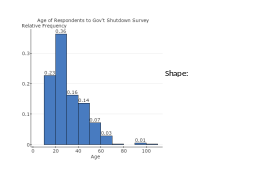
Slide 2
Slide 3
Slide 4
Slide 5
Slide 6
Slide 7
Slide 8
Slide 9
Slide 10
Slide 11
Slide 12
Slide 13
Slide 14
Slide 15
Slide 16
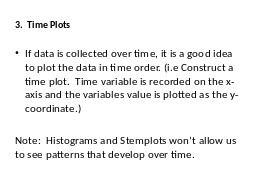
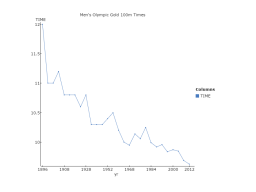
3. Time Plots
Slide 18
Slide 19
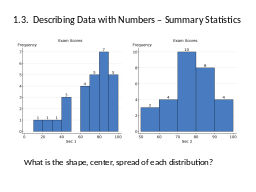
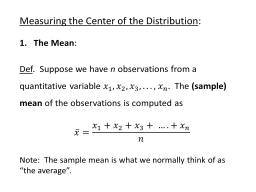
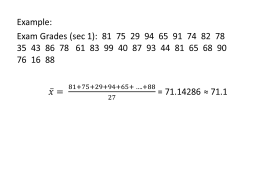
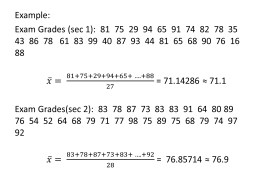
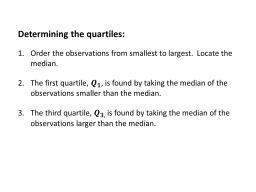
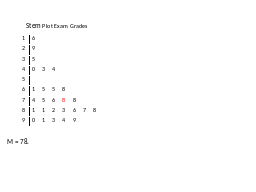
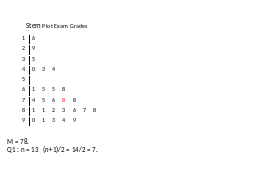
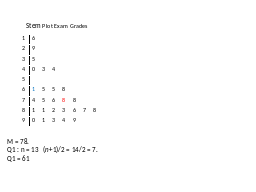
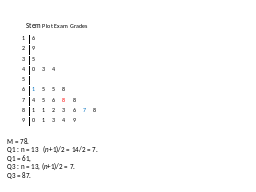
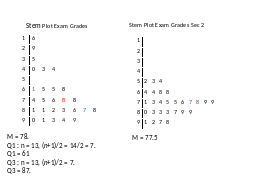
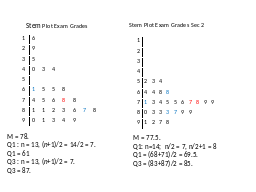
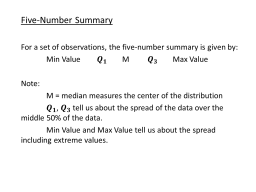
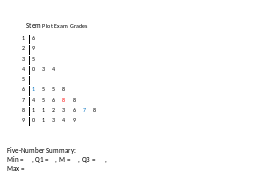
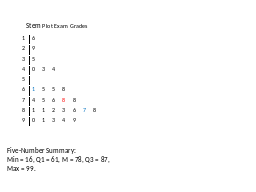
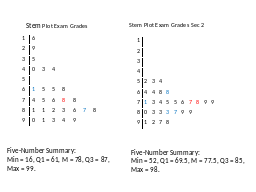
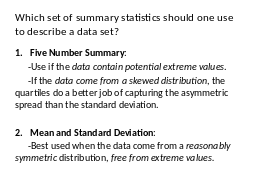
1.3. Describing Data with Numbers – Summary Statistics
Slide 21
Slide 22
Slide 23
Slide 24
Slide 25
Slide 26
Slide 27
Slide 28
Slide 29
Slide 30
Slide 31
Slide 32
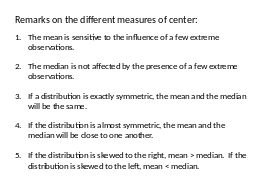
Remarks on the different measures of center:
Remarks on the different measures of center:
Remarks on the different measures of center:
Remarks on the different measures of center:
Remarks on the different measures of center:
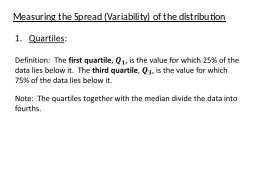
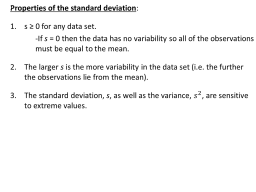
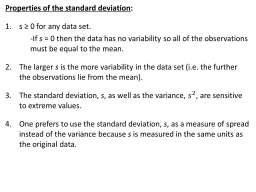
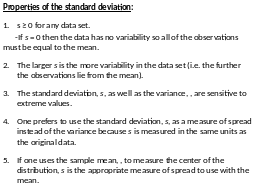
Measuring the Spread (Variability) of the distribution
Slide 39
Slide 40
Slide 41
Slide 42
Slide 43
Slide 44
Slide 45
Slide 46
Slide 47
Slide 48
Slide 49
Slide 50
Slide 51
Slide 52
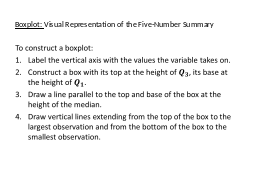
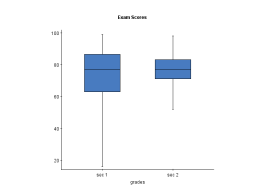
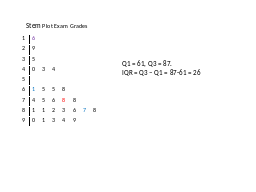
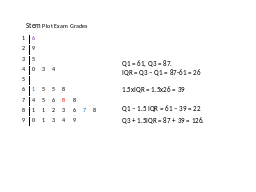
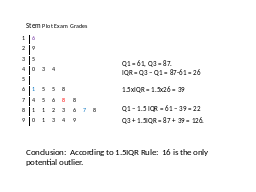
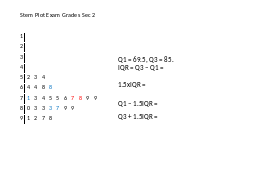
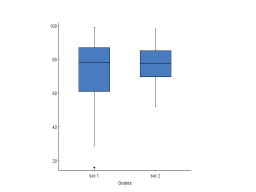
Boxplot: Visual Representation of the Five-Number Summary
Boxplot: Visual Representation of the Five-Number Summary
Boxplot: Visual Representation of the Five-Number Summary
Boxplot: Visual Representation of the Five-Number Summary
Boxplot: Visual Representation of the Five-Number Summary
Slide 58
Slide 59
Slide 60
Slide 61
Slide 62
Slide 63
Slide 64
Slide 65
Slide 66
Slide 67
Modified Boxplot (Box and Whisker Plot)
Slide 69
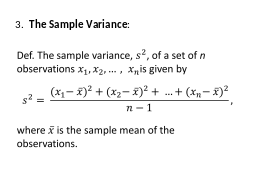
3. The Sample Variance:
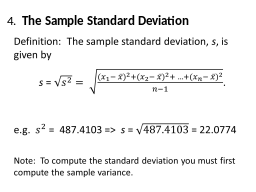
4. The Sample Standard Deviation
Slide 72
Slide 73
Slide 74
Slide 75
Slide 76
Slide 77